Strong growth figures from Mphasis, EPAM. LTI, Coforge, Persistent and Genpact help the mid-tier firms post strong overall growth for Q3. The mid-tier has followed the global majors (see here), posting more substantial revenue increases compared to Q2.
The Market Prescience financial charts got an additional injection of data – adding a longer list of providers, including some of the mid-tier providers (less than $5B in service revenue in 2019) and some of the more BPO oriented players like Genpact, WNS and EXL.
The full list of additions includes LTI, Virtusa, Mphasis, Mindtree, Hexaware, Zensar, Coforge, Persistent, Unisys, SopraSteria, EXL, WNS, Genpact, Indra, T-Systems, EPAM, and Tieto Evry. Plus, CGI Q3 revenues got added.
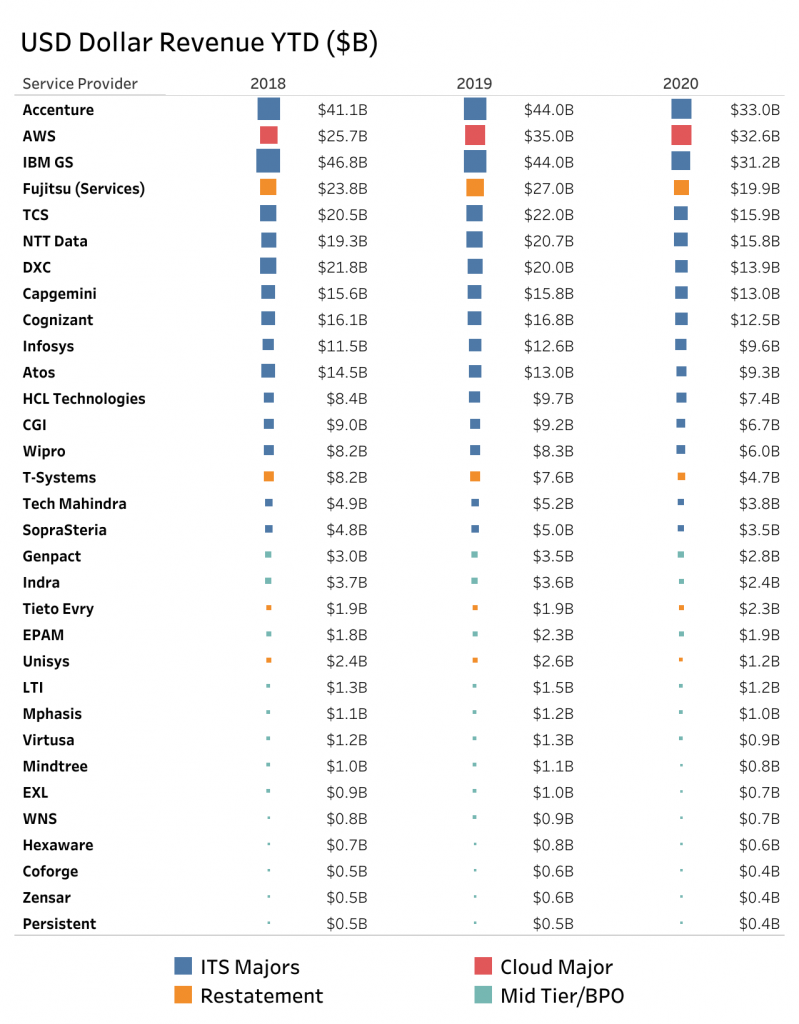
You can see the full list of players with revenues for each year in Exhibit 1 – 2020 is the year-to-date (YTD) figure up to Q3, not a forecast, don’t worry!
Exhibit 1 – IT Services Players Historic revenue 2018 to 2020 YTD
[iframe width=”640″ height=”820″ seamless frameborder=”0″ scrolling=”no” src=”https://public.tableau.com/views/EarlyBirdRev2/USDComparisonYTD?:language=en-GB&:display_count=y&:origin=viz_share_link&:showVizHome=no&:embed=true”]
Source: Market Prescience Analysis of Company Financials. (See note below for details)
The legend at the bottom of the chart shows the categories we have applied. We have had to add some additional categories other than just the leading global players and the mid-tier providers. Fujitsu, T-Systems, Unisys, and TietoEvry are placed into a restatement category. This reminds us to exclude these firms from any aggregate analysis because there numbers would skew the results. For example, T-Systems has restructured, shifting a non-IT part of their business into another division of Deutsche Telekom. Fujitsu has changed the way they report services, Unisys made a major divestment, and the merger of Tieto and Evry makes any historic comparison hard. We will make an effort to adjust the growth figures for these firms as we go forward, but for the time being, including we have included their raw data, but are not including them in the growth analysis.
Exhibit 2 shows the average and weighted average quarterly growth from 2017 to Q3 2020 – split into the ITS Majors and the Mid-Tier. You can add in the other categories or deselect groups using the dropdown. Also, you can see the data for a specific point by running the cursor over it.
Exhibit 2 – Quarterly Growth Rates – Mid Tier v Global Majors
[iframe width=”600″ height=”600″ seamless frameborder=”0″ scrolling=”no” src=” https://public.tableau.com/views/EarlyBirdRev2/WeightedAverageMidvGlobal?:language=en-GB&:display_count=y&:origin=viz_share_link&:showVizHome=no&:embed=true”]
Source: Market Prescience Analysis of Company Financials. (See note below for details)
As you can see from the data – both groups experienced an uplift in Q3 in revenue growth on average – with the mid-tier starting from a higher base. It’s good to see the performance was not limited to the global majors, and the uplift was enjoyed relatively universally. Although if you look at the individual performance of the providers, it was pretty mixed.
Exhibit 3 shows the quarterly year-on-year (YoY) revenue growth and operating margin performance for these service providers. The size of the bubble indicates the size of revenue. The chart allows you to select which of the suppliers are included in the comparison using the dropdown menu and tick boxes –you can cycle through the quarters to see the historical position using the slider.
Exhibit 3 – Financial Performance of the Mid-Tier
[iframe width=”600″ height=”600″ seamless frameborder=”0″ scrolling=”no” src=” https://public.tableau.com/views/EarlyBirdRev2/SupplierPerfmid-tier?:language=en-GB&:display_count=y&publish=yes&:origin=viz_share_link&:showVizHome=no&:embed=true”]
Source: Market Prescience Analysis of Company Financials. (See note below for details)
You can see that Q3 2020 mid-tier had mixed performance – but the group overall performed better than Q2 as seen in Exhibit 2, you can compare with the Q2 2020 data using the slider. Mphasis, EPAM. LTI, Coforge, Persistent, and Genpact managed to maintain good performance throughout the pandemic, which has helped to bolster overall performance over Q2.
Although the pandemic’s impact on the IT services market in Q2 was severe, many providers have started to see some recovery in growth. Although it is still early days, and we have yet to see longer-term economic impacts affect the market – the initial impact has been shorter than anticipated. Given the optimism injected into markets by news of the vaccine and the change in US government, the 2021 demand for IT services seems likely to bounce back well.
So how is this likely to translate into market growth? We’ve seen c2% recovery Q2 to Q3 in the IT Services market players. This means we’ll see year on year growth back to 4-5% if the current trend continues into Q1 2021. There are worse scenarios where the Q3 uplift was a “false” bounce with the uplift just from delayed projects being green lighted post lockdowns. This will all be tempered by deeper financial issues – but we believe this is unlikely. Given the overall shift in optimism, there is room for more positive projections, mainly if the appetite for IT Services has been fuelled by changing working practices and a doubling down on digital.
Note regarding financial performance data. All quarters are as close to the calendar quarter as possible. Some margin data has been estimated – either by splitting annual or half-year totals or from the management commentary for example, Atos & Capgemini Q3 was estimated from full-year guidance. Q3 2020 data will be appended as it is announced. It is also worth noting that Capgemini’s revenue growth for Q2 & Q3 2020 has been boosted by the acquisition of Altran. Comparing Capgemini Q3 2020 revenue with the combined Q3 2019 revenue of both companies would have shown a decline of -5.6%. Fujitsu has changed the way it reports its revenue for the current financial year, as we go forward we will use the whole Technology Solutions revenue figures and replace the previous revenue data as it becomes available – so the growth rates may not be accurate until further analysis is done when we get a complete fiscal year with the new reporting structure. We have used historical growth rates to avoid mismatched peaks caused by restating the data for some quarters.