This post updates the Q3 2020 financial performance data with DXC’s figures. Adding this data has changed the position a little – with the bounce in Q3 less pronounced overall.
The average YoY growth for the leading Q3 service providers has dropped from an increase of 0.6% to a decline of -0.3%. So now a 2.0% improvement from 2.3% decline in Q2 2020, on average. We have also removed Fujitsu Services revenue from the analysis, as its financials need more investigation to properly adjust the figures to a purer services number and reconcile its historical data properly given its recent change in reporting. Exhibit 1 shows the weighted average YoY growth as well as the pure average and this shows a bigger bounce than the average, as the single provider performance has less impact.
Exhibit 1 is a new chart that shows the average growth against the weighted average growth – you can adjust the providers included in the analysis using the dropdown – to reinclude Fujitsu or AWS, for example, and see the impact.
[iframe width=”600″ height=”600″ seamless frameborder=”0″ scrolling=”no” src=”https://public.tableau.com/views/EarlyBirdRev2/WeightedAverageDB?:language=en-GB&:display_count=y&publish=yes&:origin=viz_share_link&:showVizHome=no&:embed=true”]
Source: Market Prescience Analysis of Company Financials. (See note below for details)
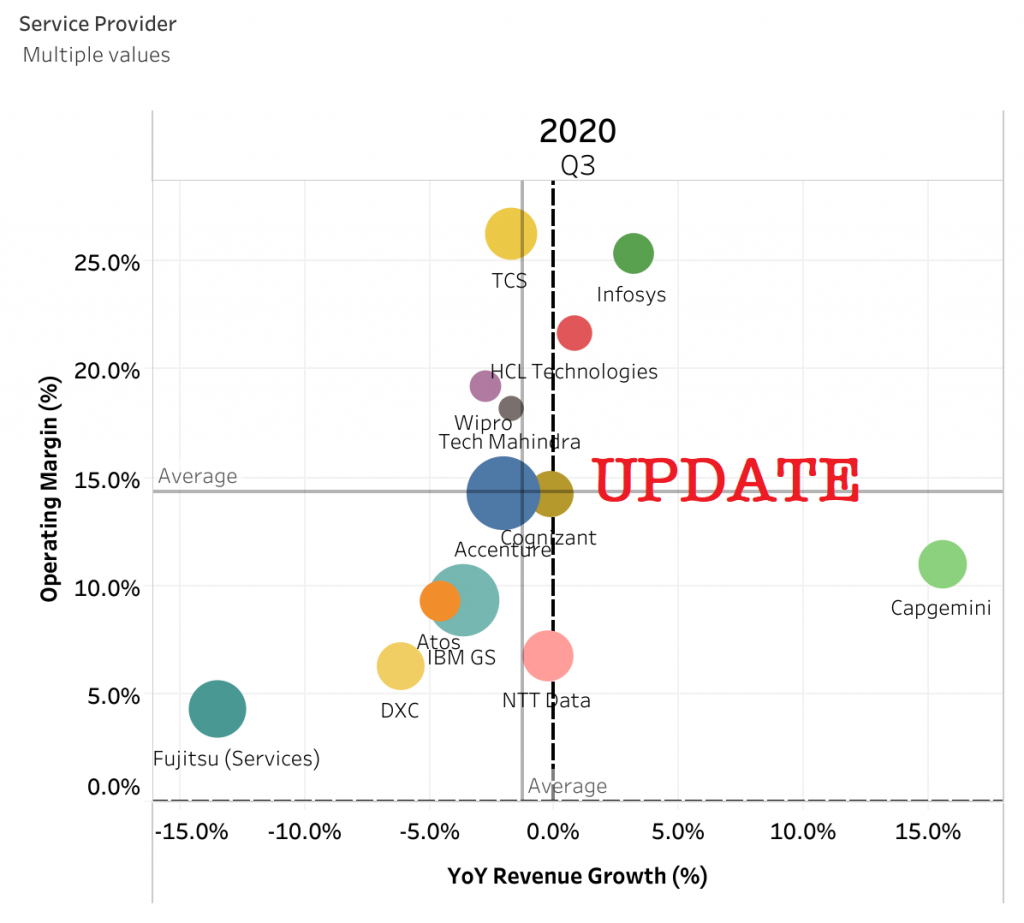
As the Q3 results season draws to a close, with only DXC, and CGI of the major IT Services vendors to publish results we can see the bounce back in the market from Q2 to Q3 2020 properly. Exhibit 1 shows the average revenue growth and margin for the 12 providers that have been published so far: IBM GS, Accenture, Capgemini, Atos, TCS, Cognizant, Infosys, Wipro, HCL Technologies, Fujitsu (Services), NTT Data, and Tech Mahindra. AWS results can be added to average using the drop down – in fact you can use this to select and deselect the players in the list.
Exhibit 2 – revenue growth and margin of the leading IT Services providers to Q3 2020.
[iframe width=”600″ height=”600″ seamless frameborder=”0″ scrolling=”no” src=”https://public.tableau.com/views/EarlyBirdRev2/Individualperformance2?:language=en-GB&:display_count=y&publish=yes&:origin=viz_share_link&:showVizHome=no&:embed=true”]
Source: Market Prescience Analysis of Company Financials. (See note below for details)
Exhibit 3 allows you to select which of the suppliers are included in the comparison using the dropdown menu and tick boxes – but you can still cycle through the quarters to see the historical position.
[iframe width=”600″ height=”600″ seamless frameborder=”0″ scrolling=”no” src=”https://public.tableau.com/views/EarlyBirdRev2/SupplierPerf?:language=en-GB&:display_count=y&publish=yes&:origin=viz_share_link&:showVizHome=no&:embed=true”]
Source: Market Prescience Analysis of Company Financials. (See note below for details)
We are looking to add more service providers to this analysis over time – in particular, the mid-tier companies. Looking at their performance, this would likely show a more pronounced bounce, particularly in the average growth.
Note regarding financial performance data. All quarters are as close to the calendar quarter as possible. Some margin data has been estimated – either by splitting annual or half-year totals or from the management commentary for example, Atos & Capgemini Q3 was estimated from full-year guidance. Q3 2020 data will be appended as it is announced. It is also worth noting that Capgemini’s revenue growth for Q2 & Q3 2020 has been boosted by the acquisition of Altran. Comparing Capgemini Q3 2020 revenue with the combined Q3 2019 revenue of both companies would have shown a decline of -5.6%. Fujitsu has changed the way it reports its revenue for the current financial year, as we go forward we will use the whole Technology Solutions revenue figures and replace the previous revenue data as it becomes available – so the growth rates may not be accurate until further analysis is done when we get a complete fiscal year with the new reporting structure. We have used historical growth rates to avoid mismatched peaks caused by restating the data for some quarters.