Market Prescience is in the process of rolling out its market sizing and forecasting, which makes this an excellent time to write about how you should approach market sizing and how we are doing it.
Estimating the size of markets can be a challenging undertaking, mainly if organizations rely on the numbers for marking crucial business decisions like expanding into new markets, deciding on a potential acquisition, or choosing between alternative research investments. There shouldn’t be any question surrounding the market’s definition or the method being used.
Market Prescience’s aim is consistency and accuracy. So we use a combination of approaches to size and forecast the IT and Technology Services markets – maintaining a consistent primary approach between markets with different structures and using the right secondary and tertiary methods to verify, adjust, and fine-tune for specific markets.
Market Sizing
There are two main methods to approach sizing markets, described as top-down and bottom-up. These can be applied using two different types of data: supply-side and demand-side. All of these ways will tell you something about the market, and each has its advantages and disadvantages. Market Prescience uses them all in order to maximize the advantages of each approach and minimize the disadvantages.
Exhibit 1 – Market Sizing Approaches
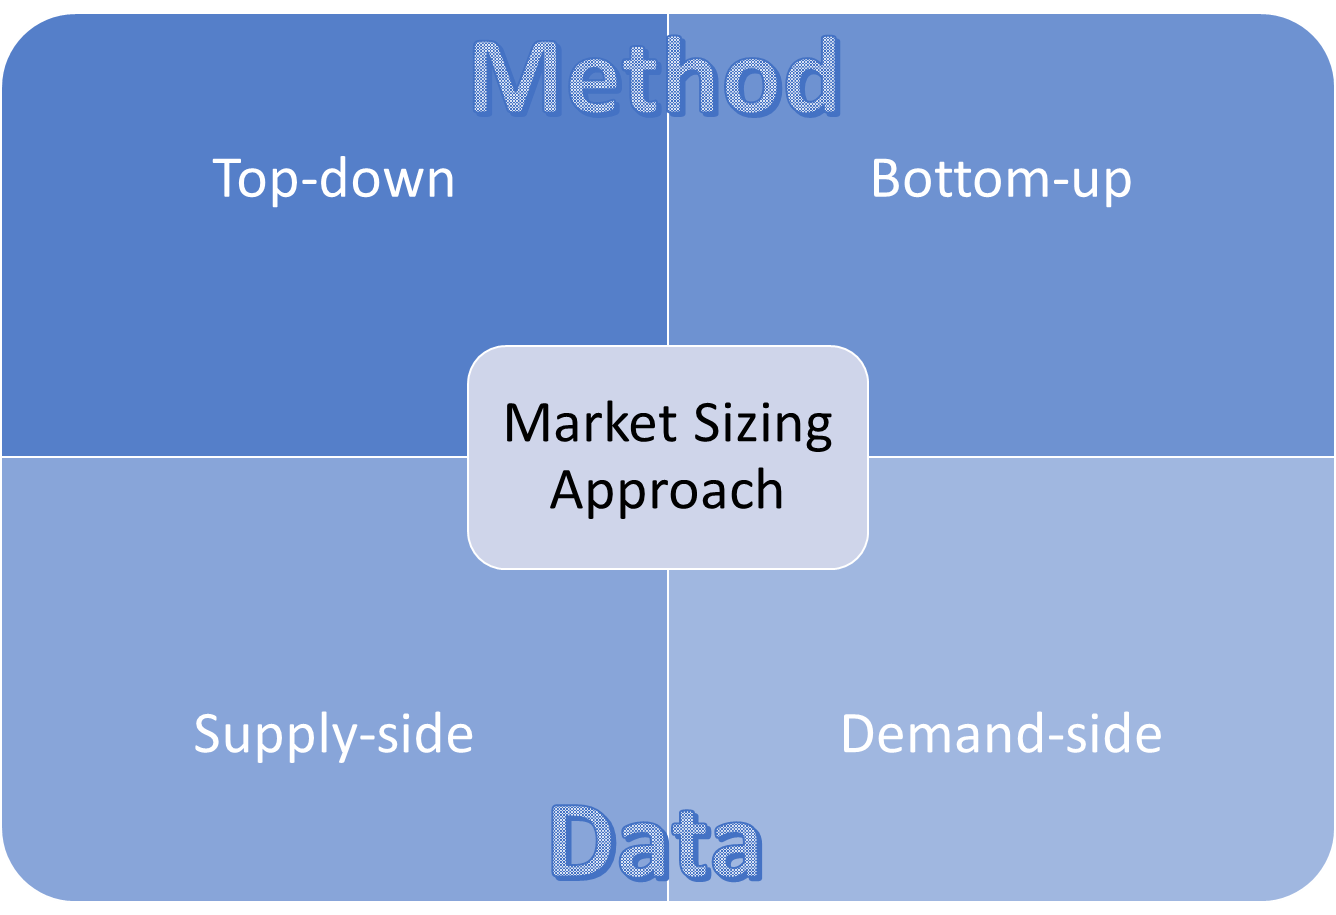
Source: Market Prescience 2020
Bottom-up market sizing is where the method looks to build total markets from smaller components. For example, when sizing the total IT Services market, you first size the consulting markets, then the outsourcing markets, etc… then add them together to create the total market. Top-down is the exact reverse – you start by sizing the total IT services market, if you have data that says the market for consulting is 20% of the total, you’d use that proportion of the total to size the consulting market as a submarket.
For most markets, supply-side data would be revenue estimates for all of the leading players – in this case, the IT service providers, but it can also include contract data where this is available and of sufficient quality. Demand-side data quantifies the typical spending made by buyers of IT services. This spending could start with revenues of individual large corporations, overall industry sector demographics, survey data, and benchmarks that indicate specific behaviour between groups of buyers by industry, service line, company size, or geography.
So what are the advantages of each method?
Exhibit 2 examines the advantages and disadvantages of each sizing method.
Exhibit 2 – Take Advantage of the Right Approach
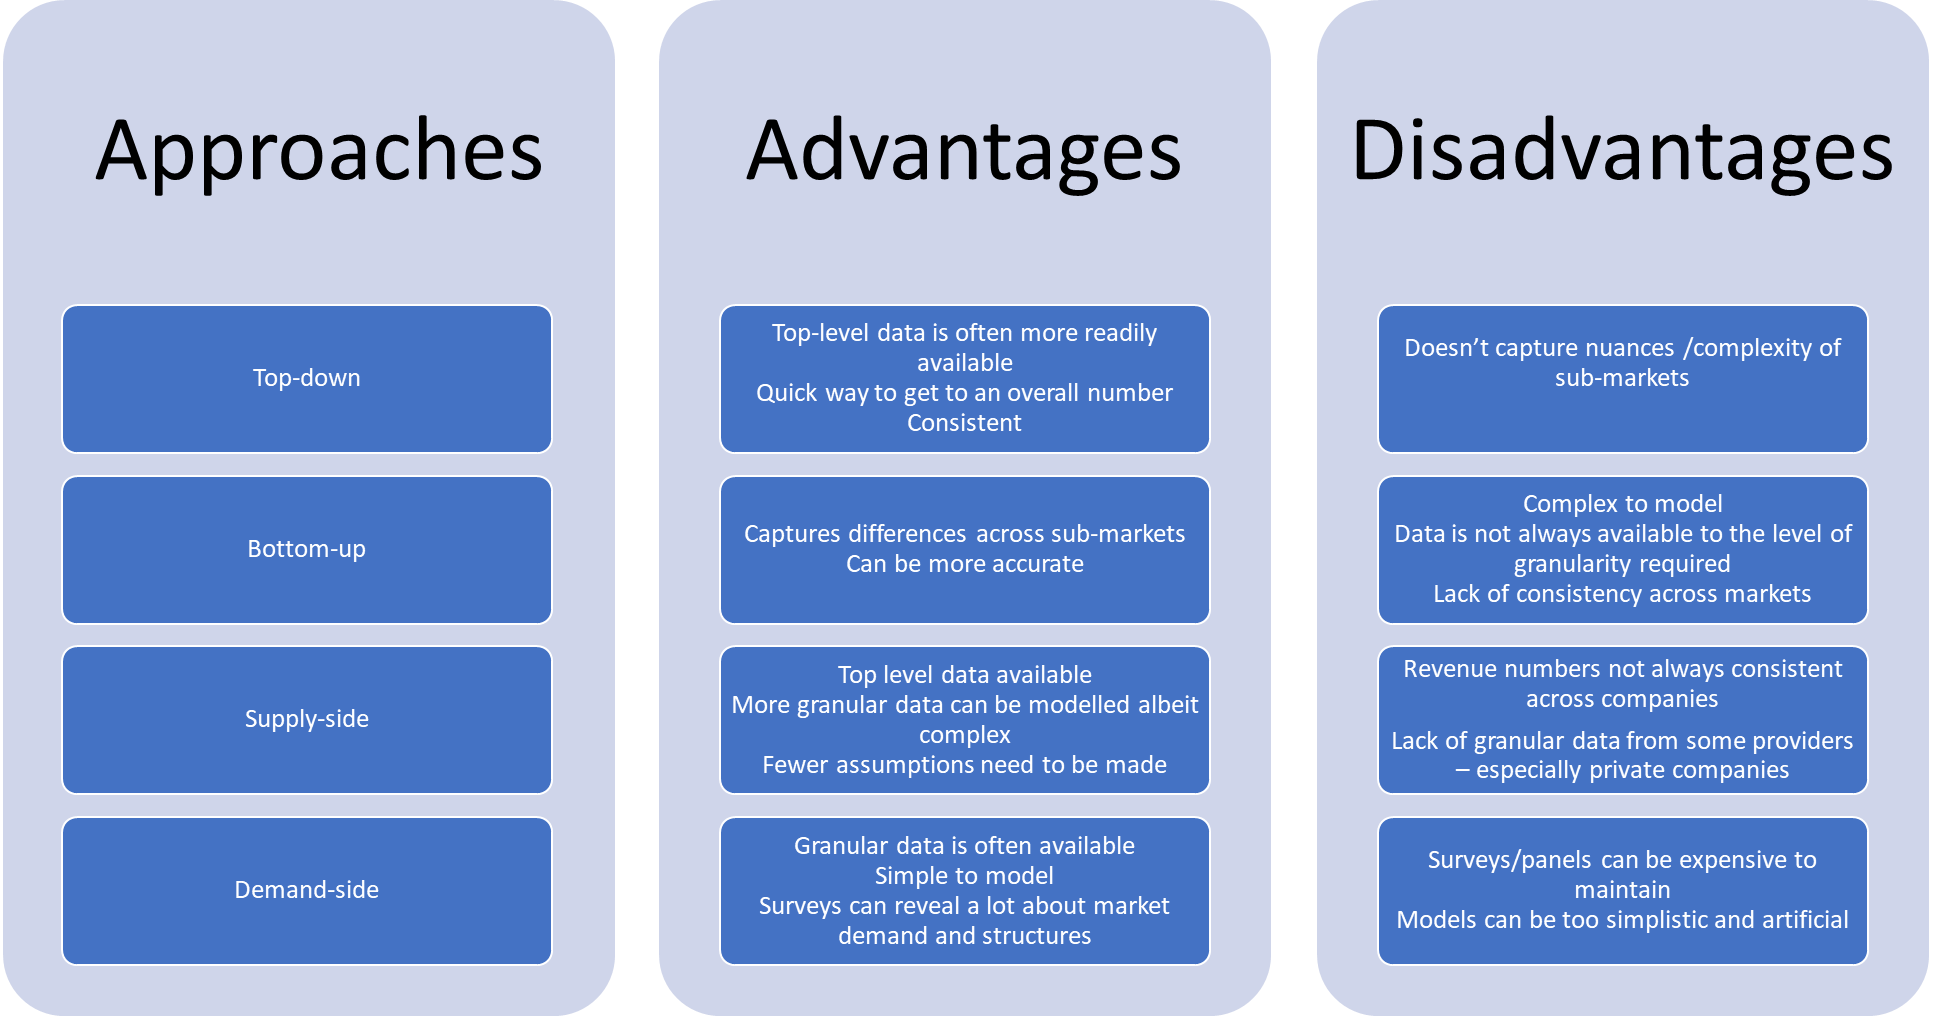
Source: Market Prescience 2020
As you can see from the chart, all of the approaches have advantages and disadvantages, which means that the best approach is to use a combination and to have each method cross-check the other.
The primary method adopted by Market Prescience is a combined top-down and bottom-up supply-side method. This means that we create a revenue database of all the main service providers across each service category. Each provider has its own model, which converts its own published revenue into a set of standard Market Prescience-defined markets by country, by industry, and by service line. The output from this database is compiled bottom up, starting with the service line, then the geography, and the industry.
The service provider rankings generated at this point are reviewed top-down and bottom-up to ensure that the market is consistent with our analysis and current understanding of the market. The next step is crucial – estimating the proportion of the market not covered by the vendor database. For most market segments you won’t have a complete list of players – particularly where the market is fragmented, like the consulting market. To estimate the gap, we make assumptions drawn from the structure of the market and we use a probability model to work out the sizing of the missing element.
This primary method provides a good starting point for the market size. To fine-tune this data, we use other supply-side data – for example, contract data for outsourcing categories to double-check the total market size and guide any of the sub-market splits. Then we look at demand-side data – we use survey data from buyers and demographic data to help make sure the totals fall into the right band and check that the different markets demographically make sense. For example, the size of a particular industry split makes sense in the context of the other industry splits.
Market Prescience uses the following sources of data as part of its market sizing and forecasting:
- Financial reports published by the individual companies, for example SEC filings and annual reports. This is augmented with interviewing and other feedback from suppliers – essentially each major service provider has a model that estimates revenue by geography, service line and industry as input to the sizing model.
- Publicly available demographic and firmographic information. This could include government data, financial analyst data and industry association data.
- Survey data which looks at buying behaviour and spending benchmarks within key industries and service lines, looking for example at the average consumption of IT consulting by the banking industry.
- Contract data, where available. Market Prescience uses publicly available contract data to track spend trends within the outsourcing and managed services sub-segments.
Moving on to the tricky subject of market forecasting
IT and Technology Services markets are not always the easiest to forecast. Generally, industrial forecast methods rely on historical data, which are inaccurate with volatile or rapidly changing markets. This is particularly true with new markets, especially where they are set to disrupt. We use direct financial guidance drawn from the main market players’ financial statements – this is a handy way to cap the overall market growth rate and tends to be the most accurate. The difficulty is when looking at the relative growth of sub-markets – particularly the newer, faster-growing disruptive markets mentioned above. For this, we use our survey work to determine the relative difference in demand expectation. We start the process by determining the overall market momentum from the revenue data, we make changes on industry and geographic perspective based on relative changes to economic forecasts and apply individual service line growth patterns based on analyst assumptions.
So what’s next?
Market Prescience is launching its quarterly market intelligence service in January, which provides market sizing, market share, and analysis of the IT and Technology Services market on an on-going basis. If you’d like a preview, please reach out at jamie_snowdon@marketprescience.com