Complex topics like AI need providers to demonstrate knowledge
Market Prescience is keen to find new ways to identify and measure trends in the technology services industry. One method we are looking to use is the analysis of social media posts. Looking at trends within the different topics by seeing what is being engaged with and why. Here we step you through how we are doing this.
The first step in this process was to look at the levels of engagement the different players within the IT Services industry generate from their social media activities. The first experiments with this have been with Twitter as API access is relatively easy – but we’ll also look at LinkedIn and Instagram over time.
So, we grab all the posts – we do this daily using the relevant social media API. The chart below shows the total number of posts every day across all the service providers included in the study. Just for clarity, we used the primary Twitter account names for all the service providers – we will refine this going forward particularly for companies where there is a common name used to reference them which is different from their social media handle.
[iframe width=”650″ height=”860″ seamless frameborder=”0″ scrolling=”no” src=” https://public.tableau.com/views/OverllSocialMediaAnalysis/Allposts?:language=en-GB&publish=yes&:display_count=n&:origin=viz_share_link&:showVizHome=no&:embed=true”]
Source: Market Prescience analysis of Twitter*
As you can see there are 1000s of engagements daily across all these accounts – the median is around 2,900 per day and the average 3,600 (you can hover the cursor over the chart to see the exact values). This is engagement within the specific social media accounts so includes all posts from and to them. So you can see there were a couple of days around the 22nd of August where there was a very large level of engagement.
To figure out what this peak was about and to look at the level of engagement across companies – we can add this to the next chart. This also shows the total number of posts and the unique posts – the unique posts remove all that are identical – although retweets with a slight change or addition would be considered unique.
You can see that there is a large spread in engagement across the different firms, at least directed at the main Twitter handle. Infosys gets plenty of tweets directed at this account, with a large uptick in activity in August.
[iframe width=”650″ height=”860″ seamless frameborder=”0″ scrolling=”no” src=” https://public.tableau.com/views/OverllSocialMediaAnalysis/Overallactivity?:language=en-GB&publish=yes&:display_count=n&:origin=viz_share_link&:showVizHome=no&:embed=true”]
Source: Market Prescience analysis of Twitter*
The next stage in the analysis looks at whether the interaction is broadly positive or broadly negative. Although this activity is prone to error and can be subjective at an individual post level. It can be informative about the overall nature of engagement – we use the VADER sentiment tool which is around 75-80% accurate for social media posts, but we are experimenting with custom models to enhance the performance. It will never be 100% accurate – partly because of the nature of any machine learning technique, but largely because sentiment is subjective and layered. The post might intend to be positive about an organizations sustainability but the overall sentiment of the tweet is negative toward the climate issue. You can imagine other topics like security could be equally challenging. The following chart divides the unique posts by sentiment for all the providers.
[iframe width=”650″ height=”860″ seamless frameborder=”0″ scrolling=”no” src=” https://public.tableau.com/views/OverllSocialMediaAnalysis/Overallactivitywithsentiment?:language=en-GB&publish=yes&:display_count=n&:origin=viz_share_link&:showVizHome=no&:embed=true”]
Source: Market Prescience analysis of Twitter*
Again, you can see the huge engagement differences between the organizations – with some getting relatively low levels of interactions, particularly when you look at the leading providers. You can also see differences in the overall tone of engagements, with some attracting larger proportions of negative engagement than others. One source of Infosys’ high levels of engagement and negativity can be tracked back to the Indian Inland Revenue portal – with high volumes of engagement from people unhappy with the service. This can drive a great deal of interaction at specific times, for example, this explains the peak in posts around the 22nd of August.
To cut through the noise of the general interactions we can examine whether individual topics, like AI or cloud or security, manage to cut through. The next chart extracts the posts that mention AI or machine learning – this is simply looking at AI and Machine Learning related keywords within posts, as we move forward, we will look to broaden the keyword search and use more sophisticated techniques to identify AI-related topics.
[iframe width=”650″ height=”860″ seamless frameborder=”0″ scrolling=”no” src=” https://public.tableau.com/views/SocialMediaActivityofLeadingITServicesFirmsAI/AIDash?:language=en-GB&publish=yes&:display_count=n&:origin=viz_share_link&:showVizHome=no&:embed=true”]
Source: Market Prescience analysis of Twitter*
This shows that despite lower levels of overall engagement – you can cut through at an individual topic level. With IBM, Atos, Capgemini, Cognizant, and Accenture driving the most engagement around AI within the technology services industry.
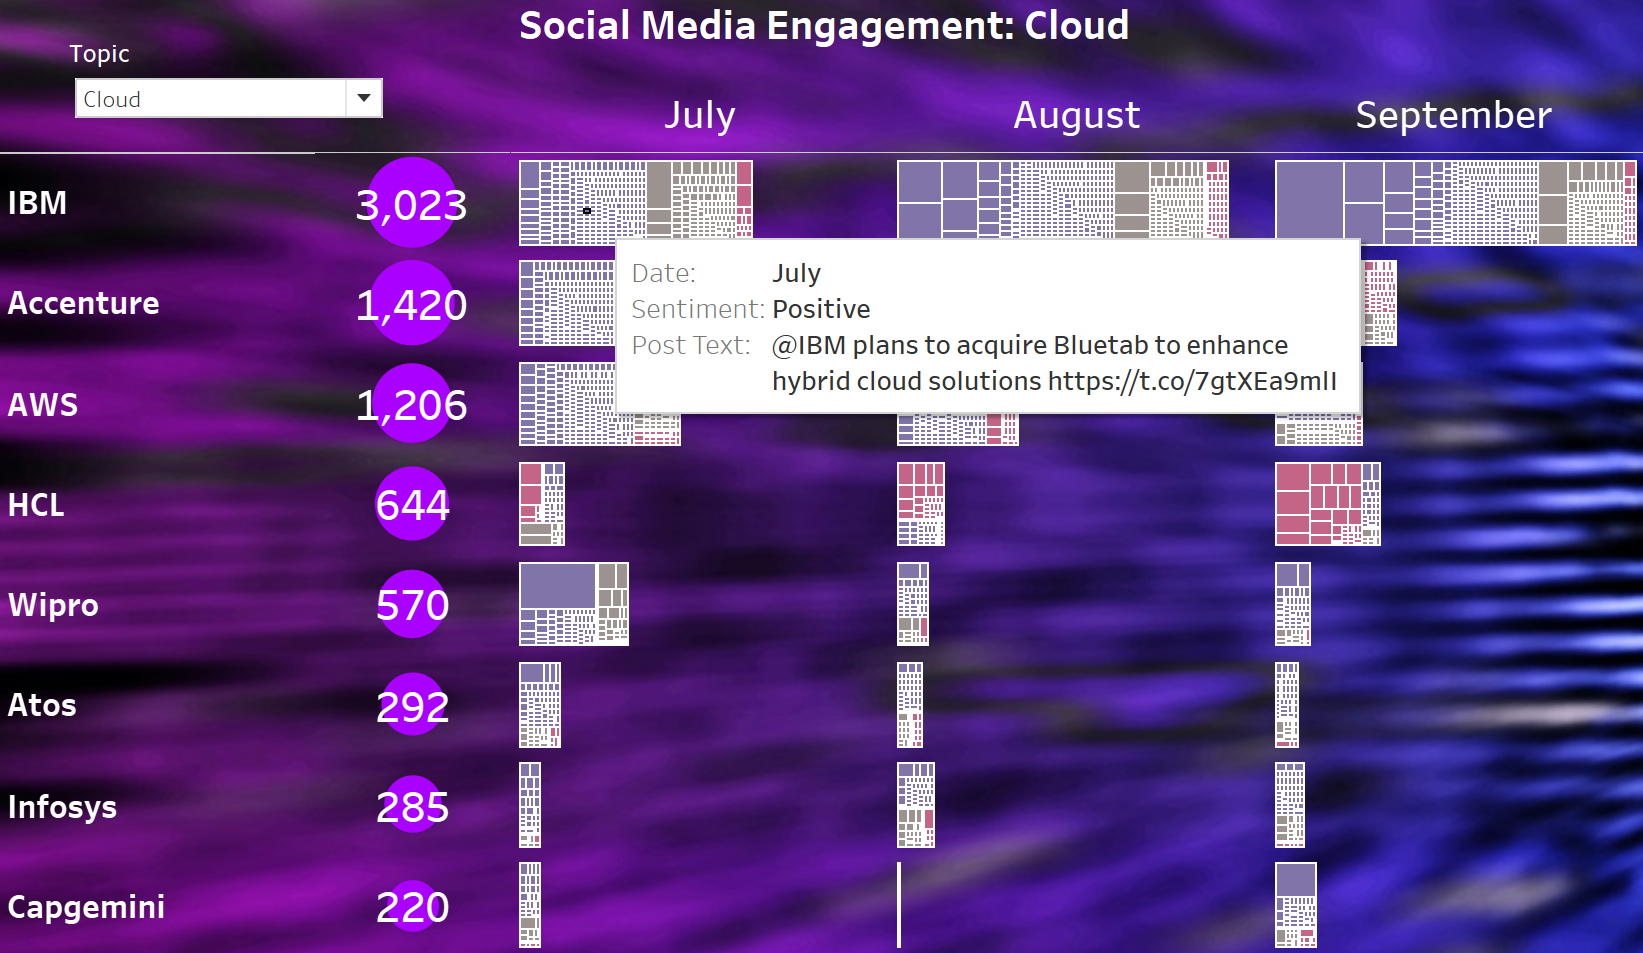
To examine what the interaction looks like in more detail the following version of the chart allows you to examine the individual posts that make up the engagement. The bars are made up of squares that represent each individual post – so you can run the cursor over them to reveal the details.
[iframe width=”650″ height=”860″ seamless frameborder=”0″ scrolling=”no” src=” https://public.tableau.com/views/SocialMediaActivityofLeadingITServicesFirmsAI/AIDashDetails?:language=en-GB&publish=yes&:display_count=n&:origin=viz_share_link&:showVizHome=no&:embed=true”]
Source: Market Prescience analysis of Twitter*
By examining the content of the posts directed at the suppliers at the top of this table it is clear that much of the engagement is driven by solid programs of thought leadership and marketing activity that promotes use of AI and machine learning technology across these organizations and their clients.
IBM is getting traction through a joined-up approach to its marketing on the topic – highlighting product advances, customer case studies, and research. It’s good to see that its sponsorship activities are helping to promote discussions on technology – the use of AI and cloud to communicate better level of insights to tennis fans.
Accenture is driving engagement through its research activities with AI roadmaps, industry-level use cases, and client case studies. Atos takes a similar approach with AI roadmaps and use cases, plus some uplift from its Graphcore partnership. Like Atos, Capgemini very effectively cuts through with its messaging. Although it has lower levels of activity overall, the engagements it does have are on-topic, particularly around AI. Promoting its research and use cases.
Firms with lower levels of engagement are either not actively promoting activity or are producing content that is not cutting through. Topics like AI are tricky to market because audiences have diverse ranges of both cynicism and understanding. So, the only way services companies can cut through properly is the combined approaches taken above. Firstly, demonstrate a broad knowledge of the technology within a domain through use cases and research, whilst promoting success stories. Just retweeting positions in analyst grids doesn’t seem to be cutting through, particularly in complex areas like AI!
*Methodology. Market Prescience analyzed the activity of the service provider’s primary social media handles on Twitter since the 4th July 2021. Using the VADER sentiment analysis tool to determine whether the tweets are broadly positive, negative, or neutral. Market Prescience used keywords contained within the posts to determine whether it concerned AI – these were simply machine learning, ML, artificial intelligence, and AI. The algorithm removes identical tweets – so basic retweets are excluded, but it will include retweets that have any differences. Another caveat involves the nature of any machine learning or classification technique – the analysis may include some posts falsely classified in the sustainability pot and the sentiment may not always be accurate. The idea here is to quickly show the macro trends through the aggregate rather than obsess on each data point, although we expect the process to improve over time.